Friday, December 29, 2017

EYE ON ACC ; BULLISH (1 JAN TO 05 JAN) 2018


“I hope that 2017 has been a successful year for you! 
Thank you for taking the time to interact with us, we are very thankful! 
and to wish you the very best for the New Year...!!!!

BUY ACC ABOVE 1778 TGT 1800/1850 SL 1750

ACC, after showing correction from the higher level, now after giving breakout of its range-bound movement, it is forming continuation pattern in short-term charts, it is likely to continue the Positive movement with the breakout of the pattern at the resistance levels of 1778 ; as the stock is managing to trade above its 22,50 and 200 days moving averages with the RSI of 59, one may expect the targets of 1800/1850 in the stock if it manages to sustain above the immediate resistance  level of 1778. 200 EMA is seen as a strong support level of 1681. Strong resistance is seen at 1800.
DAILY CHART FOR ACC

Thursday, December 28, 2017

LT IS IN SHORT TERM REVERSAL PHASE


MINDTREE BULLISH; AS PREDICTED ON 26 DEC 2017

 ACHIEVED TGT 625 ..!!
TOTAL PROFIT: 24000 PER LOT

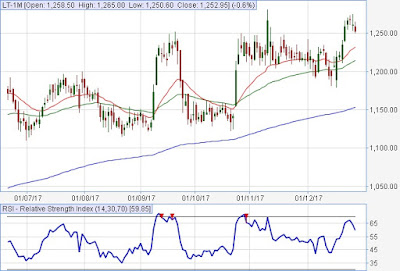
SELL LT BELOW 1250 TGT 1230/1210 SL 1275
After showing strong bullish movement, it is forming a reversal pattern in short-term charts, the Primary trend of the LT is bearish. Strong Support level is seen on the daily chart at 1250. it is likely to show correction with the breach of the support level of 1250, where one may initiate the short position in it for the targets of 1230/1210, while stop loss can be placed at 1275. On the other side, It is likely to continue the upside move in near term with the crossing of the resistance level of 1275. as the stock is managing to trade above its 22& 50 and 200 days moving averages with the RSI of 60.  After the breakout, the level of 1275 One may get the targets of 1295,1320 in the stock with the stop loss of 1245.
DAILY CHART FOR LT:


Wednesday, December 27, 2017

MINDTREE FUTURE CALL ROCKS.. !!


MINDTREE ACHIEVED TGT 612 MADE HIGH OF 619.90 

TOTAL PROFIT: 17880 PER LOT
CALL GIVEN YESTERDAY.

TO READ PREVIOUS POST CLICK

TO GET STOCK FUTURE CALLS WHATS UP ME
ON 09039542248 OR FILL UP UR MOBILE NO HERE>>>
DAILY CHART FOR MINDTREE

Tuesday, December 26, 2017

LONG-TERM TIMEFRAME CONTINUES TO REMAIN UPWARDS IN MINDTREE


BUY MINDTREE ABOVE 605 TGT 612/625 SL 595


After showing correction from the higher level (799) since the long-term, now the stock is trading in the recovery phase for the medium term, it is likely to continue the upside move in near term with the crossing of the resistance level of 605 as the stock is managing to sustain above the level of 560.  It is likely to continue the positive movement with the breakout of the pattern at the levels of 620. 22 &55 and 200 days moving averages seen as support level with the RSI of 72, and also showing the breakout trendline. One may get the long-term targets of 625,700,750 in MindTree with the stop loss of 535. Thus the trend of the MindTree in the short term, medium term, and even the long-term timeframe continues to remain upwards.

DAILY CHART FOR MINDTREE:


Saturday, December 23, 2017

SBIN WEEKLY OUTLOOK & CHART FOR 26 DEC 2017

BUY SBIN FUTURE ABOVE 320 TGT 326.8/336.8 SL 313"

"SELL SBIN FUTURE BELOW 315 TGT 310/305.5 SL 321.4"
Past week on 18 Dec SBIN future has opened at 306 made a high of 324.70 and low of 300 & finally on Friday 15 Dec closed at 320.65 , total 24.70 points movement was there in the SBIN future last week. For the upcoming week SBIN future is having the support of 315 & 305.50 while the resistance will be 320/336.8.

Thursday, December 21, 2017

MARUTI & SAIL VIEW FOR 22 DEC 2017

"SELL MARUTI FUTURE BELOW 9650 TGT 9614/9589 SL 9688"

"BUY SAIL FUTURE ABOVE 87.15 TGT 87.80/88.70 SL 85.20"
Markets continued to trade sideways for the thursday. Nifty and Bank Nifty traded flat throughout the day before ending marginally lower. IT and pharma were the main sectors that relatively outperformed. The border market continued its uptrend with the Nifty midcap index closing at fresh highs.

Wednesday, December 20, 2017

MARUTI IN FIFTH GEAR; CROSSED ALL HURDLES

CALL GIVEN IN 16 DEC POST  

NET PROFIT : 28312
 As per the prediction given by me the journey of Maruti started from 9180 & fell till the level of 9020 but it was not enough again it started directly in the fifth gear and finished after crossing all the hurdles & reaching the finish point 9998.

Monday, December 18, 2017

MARUTI FUTURE CALL ROCKS....!!!!

"MARUTI FUTURE SELL CALL GIVEN IN THE LAST POST ROCKSSSS ACHIEVED 1ST TGT 12000 PROFIT IN JUST 1 LOT"

TO GET LIVE MARKET OPTION/FUTURE CALLS FILL UP THE FORM GIVEN HERE>>>>>

Bulls are back with a bang after over 850 points fall as the BJP looked set to retain power in Gujarat, with the party winning 46 seats and leading in 53 others in the keenly-contested polls to the 182-member Assembly. The Congress, which had 61 seats in the outgoing Assembly, looked to have improved its tally this time as it has won 44 seats and is leading in 33 seats so far. The index hit a high of 33801 and settled up 138 points at 33601. The gauge gained 409 points in the previous two sessions after exit polls had predicted BJP win in Gujarat and Himachal Pradesh Assembly polls. The Nifty future reclaimed the key 10400-mark to close higher by 51 points, at 10410. It moved between 10459 and 10060 intraday. Barring realty, all other sectoral indices ended in the positive zone. Among them, metal index gained the most by 1.83 %, followed by auto 1.21 %, consumer durables 0.94 % and healthcare 0.78 %. On the other hand, realty index was down 0.29 %. Top five Sensex gainers were M&M (+2.71%), Sun Pharma (+2.06%), State Bank of India (+1.97%), Wipro (+1.9%) and ICICI Bank (+1.78%), while the major losers were YES Bank (-1.23%), Coal India (-1.11%), Infosys (-0.79%), ITC (-0.62%) and Kotak Bank (-0.53%).

Saturday, December 16, 2017

MARUTI FUTURE WEEKLY PREDICTION 18 DEC TO 22 DEC 2017


“SELL MARUTI FUTURE BELOW 9180 TGT 9020/8920"
“BUY MARUTI FUTURE ABOVE 9220 TGT 9390/9485 SL 9140”
TO GET LIVE MARKET CALLS FILL UP THE FORM HERE >>>
Past week on 11 Dec Maruti future has opened at 9127 made a high of 9274 and low of 9080 & finally on Friday 15 Dec closed at 9191, total 194 points movement was there in the Maruti future last week. For the upcoming week Maruti future is having support of 9180 & 8920 while the resistance will be 9220/94824 .

Thursday, December 14, 2017

MARKET EYED GUJARAT EXIT POLL

EXPECTING GOOD VOLATILITY IN TOMORROW TRADING SESSION DUE TO GUJRAT EXIT POLLS.. TO GET LIVE CALLS PLEASE FILL YOUR NAME & MOBILE NO. HERE >>>
The Sensex ended the session higher by nearly 200 points on fag-end buying as investors turned their attention toward exit poll results for Gujarat Assembly elections. The Sensex bounced back in the last one hour of the session to hit a high of 33321 before closing up 193 points at 33246. The gauge had lost 402 points in the previous two sessions due to grim economic data and the lowering of economic growth forecast by the Asian Development Bank. Similarly, in a range-bound movement, the Nifty settled higher by 59 points at 10252. Intra-day, it shuttled between 10276 and 10141. Strengthening of rupee against the dollar also supported the domestic sentiment. Among BSE sectoral indices, oil & gas index gained the most by 0.99 %, followed by FMCG 0.69 %, banking 0.67 % and healthcare 0.63 %. On the other hand, consumer durables index was down 0.61 %, infrastructure 0.11 %, and IT 0.04 %.
Top five Sensex gainers were Dr Reddy's (+2.34%), Cipla (+2.22%), ITC (+1.87%), M&M (+1.36%), and Axis Bank (+1.24%), while the major losers were TCS (-2.62%), Sun Pharma (-0.48%), PowerGrid (-0.37%) and L&T (-0.01%).
On the upside, the Nifty has significant resistances at 10340 and 10375 levels. A conclusive rally above the second resistance is needed to strengthen the bullish momentum and take the contract up to 10400 and 10450 in the same period. Therefore, traders with a short-term perspective should desist from trading in the index futures contract as long as it trades in the sideways band between 10200 and 10300.
More about on Google +
Supports: 10200 and 10150
Resistances: 10335 and 10375

Wednesday, December 13, 2017

HINDALCO FUTURE ROCKSSSSSSS


ALSO CHECK BANKNFITY OPTION CALL ON  http://niftytipsniftylevels.blogspot.in/

FOR FRESH CALLS FILL UP THE FORM GIVEN HERE>>>>>>
Market extended losing streak to second consecutive session, nifty future losing over 100 points in two days. All eyes would be on the FED's decision on the interest rates and the tone of the commentary of future rate trajectory. Gujarat state elections outcome, which will be announced on December 18, 2017, as well as Crude oil prices, will act as important factors in dictating terms in the coming days. Nifty ended below 10250 level, which indicates further weakness is on the cards. As expected Nifty future fell to the 10190 levels. If the current momentum extends further then we expect some more minor corrective move for the Nifty future, which could take the index retesting its immediate previous low of 10030. Bank Nifty, on the other hand, fell sharply and closed exactly at the psychological 25000 mark, which is also the crucial horizontal line support zone. Going forward, the 24750 level is likely to act as a strong support zone for the Bank Nifty. While the upside will be capped around the 25400 resistance zone.

Tuesday, December 12, 2017

NIFTY VIEW FOR 13 DEC 2017

After opening flat note selling pressure was witnessed there in the market on Tuesday. ONGC witnessed a smart uptick as crude prices hit a two and a half year high, while all the oil marketing companies ended in the red. HDFC Bank was the major contributor to the losses in Nifty and BankNifty. Nifty Futures and Bank Nifty Futures ended the day 0.8%/1.1% lower and added fresh open interest to the tune of ~5.2/3 lakh shares, indicating a marginal hint of short positions. The Realty, FMCG and Banking stocks were the top losers. Even the midcap and smallcap stocks were not spared.

Monday, December 11, 2017

ICICIBANK & HINDALCO FUTURE CALL FOR 12 DEC 2017

“BUY ICICIBANK FUTURE ABOVE 313 TGT
315.4 /318.5 SL 311.2”

“SELL HINDALCO BELOW 238 TGT
236.4/235.2 SL  241.4”
The BSE Sensex closed 200 points higher at 33,455, while the NSE Nifty50 closed above 10,322. In early trade on Monday, Sensex advanced by 195 points on continuous buying by domestic institutional investors amid strong global leads. The NSE Nifty also went past the 10,300-mark.

SBI, Axis Bank, UltraTech Cement, Bharti Airtel, Maruti Suzuki, HDFC and Eicher Motors were early gainers while Infosys and HUL were losers.

Wednesday, December 6, 2017

ITC FUTURE CALL ROCKSSSSSSS

SBIN NOT EXECUTED...
Market came down after the RBI announcement of key repo rate unchanged to 6%. The Sensex closes down 205 points at 32597 points, while Nifty closes down 74 points at 10044 points. Reliance Industries (1.76 %), Maruti Suzuki (1.42 %) and Hindustan Unilever (1.05 %) were the top gainers while Sun Pharma (2.31 %), SBI (2.21%) and ICICI Bank (1.96%) were the top losers.

Tuesday, December 5, 2017

SBIN & ITC FUTURE CALL FOR 6 DEC 2017

“BUY SBIN FUTURE ABOVE 322 TGT 325.8/328 SL 319.4”

“SELL ITC FUTURE BELOW 254 TGT 252.7/251.8 SL 256.8”
In today’s trade markets remained resilient and posted strong recovery in the afternoon trade. Shriram Transport Finance and Jet Airways were the biggest F&O gainers in the trade, gaining 6% each.
HDFC Bank and ITC dragged the index most while PSU banks were among the outperformers. Nifty closed in red losing 0.1% while Nifty Bank gave a sharp recovery in last 2 hours of trade, recovering almost everything that it lost during the day.  


Monday, December 4, 2017

MARUTI FUTURE ACHIEVED 1ST TGT

"MARUTI FUTURE CALL GIVEN IN THE LAST POST ACHIEVED 1ST TGT 8550  MADE A LOW OF 8525 CONTINUE TO HOLD FOR FINAL TGT 8500 "

Range-bound trading session closed on a flat note. Today Stocks closed marginally higher as sentiments were lifted by a rally in Infosys shares and stronger Asian shares after the passage of a tax bill by the US Senate on Saturday. Any gains in Indian shares are also likely to be capped ahead of the Reserve Bank of India’s policy meeting on Wednesday. Indiabulls HF, Infosys, HCL Tech, GAIL and Hindalco gained the most on Nifty50. Bharti Infratel, UPL, Coal India, Bajaj Finance and UltraTech Cement were the top losers in today’s trade. Out of 2018 stocks traded on the NSE, 691 advanced, 998 declined, and 329 remained unchanged today. A total of 66 stocks registered a fresh 52-week high in trade today, while 26 stocks touched a new 52-week low on the NSE.

Thursday, November 30, 2017

MARUTI IS IN SHORT TERM REVERSAL PHASE


SELL MARUTI BELOW 8594 TGT 8550/8500 SL 8660

TECHNICAL VIEW:  After showing strong bullish movement, it is forming a reversal pattern in short-term charts, the Primary trend of the LT is bearish. Strong Support level is seen on the daily chart at 8594. , it is likely to show correction with the breach of the support level of 8594, where one may initiate the short position in it for the targets of 8550/8500, while stop loss can be placed at 8660. On the other side, It is likely to continue the upside move in near term with the crossing of the resistance level of 8660. as the stock is managing to trade above its 22& 50 and 200 days moving averages with the RSI of 70.  After the breakout, the level of 8660 One may get the targets of 8690,8720 in the stock with the stop loss of 8570.
DAILY CHART FOR MARUTI:

Tuesday, November 28, 2017

BULLISH: JUBLFOOD ROCKSSS


TOTAL PROFIT: 23000 PER LOT

JUBLFOOD RUNNING AT 1831 RAISE SL TO COST (1785)FOR FINAL TGT 1850

TO GET STOCK FUTURE CALLS DAILY ON UR MOBILE FILL UP UR MOBILE NO HERE>>>

DAILY CHART FOR JUBLFOOD

Monday, November 27, 2017

KEEP AN EYE ON JUSTDIAL ON 28 NOV 2017


BUY JUSTDIAL ABOVE 540 TGT 550/555 SL 530
Primary trend of the JUSTDIAL  is bullish and after giving breakout of its range-bound movement, it is forming continuation pattern in short-term charts, it is likely to continue the positive movement with the breakout of the pattern at the levels of 545 ; Overall trend of the JUSTDIAL is bullish and after experiencing small correction from the higher level. as the stock is managing to trade above its 22& 55 & 200 days moving averages with the RSI of 65, one may expect the targets of 550/555 in the stock if it manages to sustain above the immediate support level of 530. 550 level can see at strong resistance in intraday charts. it is likely to experience fresh buying with the crossing of 545.
DAILY CHART FOR JUSTDIAL:

Friday, November 24, 2017

JUBLFOOD ; BREAKOUT ABOVE THE RESISTANCE LEVEL


WEEKLY CALL: BUY  JUBLFOOD ABOVE 1785 TGT 1820/1850 SL 1750
Primary trend of the JUBLFOOD  is bullish After showing consolidation at a higher level, now the stock is trading in uptrend, it is likely to continue the upside move in near term with the crossing of the resistance level of 1800 as the stock is managing to sustain above the level of 1750. One may get the targets of 1820,1850,1875 in the stock with the stop loss of 1730. as the stock is managing to trade above its 22& 55 and 200 days moving averages with the RSI of 70. It is likely to experience fresh buying with the crossing the level of 1815, where one may keep the targets of 1850-1900 in the JUBLFOOD.

DAILY CHART FOR JUBLFOOD:

Thursday, November 23, 2017

BULLISH: SUNTV & SRF ROCKS!!!!


SUNTV  ACHIEVED TARGET 885 MADE HIGH OF 887.40 GIVES PROFIT 6800 PER LOT.CALL GIVEN YESTERDAY.

WEEKLY SRF BULLISH; AS PREDICTED ON 13 NOV
ACHIEVED TARGET 1850 

TOTAL PROFIT: 50000 PER LOT

TO GET STOCK FUTURE CALLS DAILY ON UR MOBILE FILL UP UR MOBILE NO HERE>>>

DAILY CHART FOR SRF 

Wednesday, November 22, 2017

KEEP AN EYE ON SUNTV ON 22 NOV 2017


BUY SUNTVABOVE 875 TGT 885/895 SL 850


Primary trend of the SUNTV  is bullish for now and  After showing short term correction from the higher level, now stock is trading in short-term recovery phase, it is forming continuation pattern in short-term charts, it is likely to continue the positive movement with the breakout of the pattern at the levels of 875 as the stock is managing to trade above its 22 &55 and 200 days moving averages with the RSI of 60, one may expect the targets of 885/895 in the stock if it manages to sustain above the immediate strong support level of 850. strong resistance would be seen at 890.
DAILY CHART FOR SUNTV

Tuesday, November 21, 2017

TITAN BULLISH; AS PREDICTED ON 17 NOV


WEEKLY TITAN CALL UPDATE:
ACHIEVED TARGET 820 MADE HIGH OF 827

TOTAL PROFIT: 40500 IN JUST ONE LOT

to read the previous weekly post click

FOR LIVE TRADING LEVELS WHATS UP ME
ON 09039542248
DAILY CHART FOR TITAN

Monday, November 20, 2017

TECHNICAL VIEW ABOUT STAR FOR 21 NOV 2017


BUY STAR ABOVE 800 TGT 820/850 SL 770

Primary trend of the STAR  is bullish . and  After showing correction from the higher level, now stock is trading in short-term recovery phase, it is forming continuation pattern in short-term charts, it is likely to continue the positive movement with the breakout of the pattern at the levels of 800 ; right now the stock is managing to trade below  its 22 days moving averages with the RSI of 49, one may expect the targets of 820/860 in the stock if it manages to sustain above the immediate strong support level of 790 level . 861 is seen as a strong resistance at 55 EMA.

DAILY CHART FOR STAR

Friday, November 17, 2017

RALLY OF BULLS WAS CONTINUING IN TODAY’S MARKET; NIFTY ABOVE 10280


As predicted by us in our last post “nifty will see a full action of bulls in tomorrow trading session” and exactly same happened rally of bulls was continuing in today’s market. They managed to pull nifty above the RESISTANCE levels of 10280 at 22 EMA with RSI of 50.and achieved the target of 10350 made high of 10373.made low of 10292. And for now, 22 EMA seen support levels at 10280 and 55 EMA at 10155. 10350 is the resistance level for now in nifty.          
        Sensex was trading higher by 238 or 0.72 percent to 33,345 points against the previous close of 33,106 and Nifty was up 68 points or 0.67 percent at 10,282. the Sensex soared over 400 points intraday and the Nifty raced past 10,300 as international rating agency Moody’s has upgraded India’s sovereign bond rating to Baa2 from Baa3 with a stable outlook and also noted continued progress on economic and institutional reform will enhance India's high growth potential. 

WEEKLY STOCK CALL FOR  20- 24 NOV

Thursday, November 16, 2017

NIFTY ENDS ABOVE 10,250; RALLY DOES NOT END HERE


As predicted by us in our last post a loud roar was of bulls was seen in today’s market. They managed to pull nifty above the levels 10120 of support level. But the rally does not end here we will see a full action of bulls in tomorrow trading session and also nifty may see trading at the level of 10300,10350.

The indices extended gains to settle higher on Thursday thanks to a rally in index heavyweights Infosys, State Bank of India, Reliance Industries, and TCS. The Sensex staged a strong comeback to reclaim the key 33,000-mark.The Sensex reversed its three-session losing spell. The Sensex opened to hit the day’s high of 33,165 before settling up 346 points, or 1.06%, at 33,106. And Also, the Nifty closed at 10,263, a heavy gain of 96 points, or 0.96%, after touching a high of 10,264 and a low of 10,162. Both the indices recorded single-biggest gains since 1 November.

                              Nifty has sawed a strong support today at the level of 10160 at 50 EMA and for tomorrow,  22 EMA will see a strong resistance level of 10280. It is likely to continue the positive movement with the breakout of the levels of 10280; as the nifty is managing to trade above its 22 &55 days moving averages with the RSI of 50, one may expect the targets of 10300/10350 if Nifty manages to sustain above the immediate strong support level of 10200.


Wednesday, November 15, 2017

NIFTY FALLS FOR 3 rd DAY ; STRONG SUPPORT NEAR 10000


The Sensex opened higher at 32,944 but soon turned negative before settling at 32,760, down 181 points, or 0.55 percent. The gauge had lost 372 points in the previous two sessions. The Nifty future too fell sharply by 68 points, or 0.67 percent, to settle at 10,162. Intra-day, it hovered in the range of 10,200 and 10,125. Technically, Indian Stock Market is still in the negative zone. Nifty would possess strong support near 10100 levels. The market would see continuous downtrend only if Nifty closes below 10100 levels. The market is ready for a big movement on either side. you can continue to hold short positions in the market with suggested targets. The market would enter into the positive zone only if it closes above 10210 for Nifty. Otherwise nifty would see further downfall and Next target for Nifty is set to 10120-10100-10000 levels.
The support for the Nifty is 10120-10100-10070-10040-10000 and the resistance is at 10200-10230-10255-10275-10300 levels.


Tuesday, November 14, 2017

YESTERDAY'S WOCKPHARMA BULLISH !!!


WOCKPHARMA ROCKSS ACHIEVED TARGET 745
MADE HIGH OF 746.80
TOTAL PROFIT: 12000

FOR MORE CALLS FILL UP THE FORM GIVEN HERE>>>>>

OR WHATS UP ME ON 09039542248


Monday, November 13, 2017

EYE ON WOCKPHARMA ; STRONG SUPPORT AT 200 EMA


bUY WOCKPHARMA ABOVE 730 TGT 745/770 SL 700

FOR LIVE TRADING LEVELS WHATS UP ME

ON 09039542248 >>>>>

Primary trend of the WOCKPHARMA  is bullish and now the stock is trading likely to continue the upside move in near term with the crossing of the resistance level of 730. Then it will be forming continuation pattern in short-term charts, it is likely to continue the positive movement with the breakout of the pattern at the levels of 730; Then Overall trend of the stock is bullish. If the stock is managing to trade above its 200 days moving averages with the RSI of 67, one may expect the targets of 745/770 in the stock if it manages to sustain above the immediate support level of 700. 200 EMA can see a strong support at 670. it is likely to experience fresh buying with the crossing of 643 level, where one may keep the targets of 750,770 in the stock with the stop loss of 700.
DAILY CHART FOR WOCKPHARMA: