Friday, April 7, 2017

WEEKLY TECHNICAL VIEW ABOUT JUSTDIAL

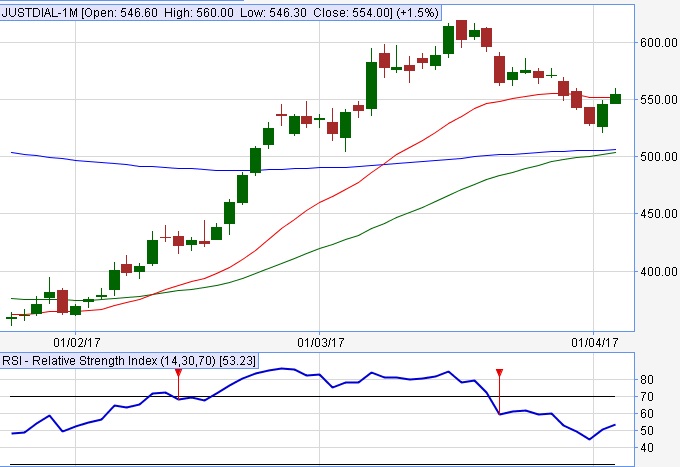
buy JUSTDIAL above 525 tgt 550/565 sl 500

Primary trend of the JUSTDIAL is bearish and After showing correction from the higher level, now stock is trading in short term recovery phase, it is likely to continue the upside move in near term with the crossing of the resistance level of 530 as the stock is managing to sustain above the level of 500. One may get the targets of 565,575 in the stock with the stop loss of 500.now MONTHLY strong support levels of 500 is seen on daily charts , it is likely to reverse and continue to the positive movement with the breakout of the pattern at the levels of 530 ; as the stock is managing to trade above its  55&200 days moving averages with the RSI of 40, 545 is the first resistance level at 22 EMA.

Thursday, April 6, 2017

CEATLTD FUTURE TRADING TIP FOR 07 APRIL 2017

buy CEATLTD above 1375 tgt 1400/1420 sl 1245

Primary trend of the CEATLTD is bullish and after giving breakout of its MONTHLY PIVORT POINT range bound movement, it is forming continuation pattern in short term charts, it is likely to continue the positive movement with the breakout of the pattern at the levels of 1490 ; as the stock is managing to trade above its 22 and 55&200 days moving averages with the RSI of 73, one may expect the targets of 1400/1440 in the stock if it manages to sustain above the immediate support level of 1300.first resistance level seen on charts at 1402.

Wednesday, April 5, 2017

STOCK FUTURE TRADING TIP FOR 06 APRIL

buy JUSTDIAL above 555 tgt 565/575 sl 540
Primary trend of the JUSTDIAL is bullish and After showing correction from the higher level, now stock is trading in short term recovery phase, it is likely to continue the upside move in near term with the crossing of the resistance level of 45 as the stock is managing to sustain above the level of 500. One may get the targets of 565,575 in the stock with the stop loss of 540.After giving breakout of its MONTHLY PIVORT POINT range bound movement, it is forming continuation pattern in short term charts, it is likely to continue the positive movement with the breakout of the pattern at the levels of 556 ; as the stock is managing to trade above its 22 and 55&200 days moving averages with the RSI of 55, first resistance level seen on charts at 569.

Tuesday, April 4, 2017

BANKNIFTY REPORT FOR FINANCIAL YEAR 2018

BANKNIFTY STILL IN POSITIVE MOMENTUM, HOLD LONG WITH STRICT SL 21295
Technically, Indian Stock Market is still in positive zone but market has witnessed divergence on the last trading session of the Financial Year 2017. Now, we are into new Financial Year 2018 and on 3 April positive movement was already decide the market direction. Some profit booking can’t be ruled out at this point of time. Market would wait for RBI Monetary Policy meeting on April 05-06 and then would see some correction before resuming the positive rally.
TO READ FULL REPORT VISIT
NIFTY TRADING TIPS

Monday, April 3, 2017

BEST STOCK FUTURE TO TRADE ON 05 APRIL 2017

buy UPL above 748 tgt 755/758 sl 740


Primary trend of the UPL is bullish and after giving breakout of its MONTHLY PIVORT POINT range bound movement, it is forming continuation pattern in short term charts and near to breakout first monthly resistance level at 750, it is likely to continue the positive movement with the breakout of the pattern at the levels of 750 ; as the stock is managing to trade above its 22 and 55&200 days moving averages with the RSI of 60, one may expect the targets of 755/765 in the stock if it manages to sustain above the immediate support level of 740/720.