Thursday, May 19, 2016

TECHNICAL ANALYSIS OF JUSTDIAL FOR 19 MAY

CEATLTD IS ON FIREEEEEEEEEEEEEE!!!!!!!!!!!!
IN BEARISH MOMENTUM: HIT TGT 975 MADE LOW OF 959.95 SELL AT 1004
LOT SIZE: 700                                                      
TOTAL PROFIT: 40600 IN JUST TWO LOT
FOR MORE JACKPOT CALLS OF FUTURE PLEASE FILL UP THE FORM GIVEN HERE >>>>>>>>>>>>>>>
FUTURE :
“BUY JUSTDIAL ABOVE 720 TGT 730/750”
 “SELL JUSTDIAL BELOW 690 TGT 680/650”
INTRADAY CHART FOR CEATLTD:
Just Dial's board meeting will be held on May 20, 2016, to consider the business as under to consider and approve the audited quarterly financial results of the Company for the quarter ended March 31, 2016, the audited financial results of the Company for the financial year ended March 31, 2016 " Just Dial   has had a huge pullback rally . So, go short with a stop loss of say around Rs 700-690 and I think that Rs 500 target should come in at some point. had a sharp rally. That may probably a bear market rally. Just Dial to my reckoning is in a bear market of its own. That downside is likely to resume and much lower levels are coming. So, even in this broadly choppy environment Just Dial is not just a short-term trade, it is also a positional short. You can keep it for some time.
  • The Sensex ended with a loss of 305 points at 25,400. The  Sensex opened at 25,714 touched an intra-day high of 25,714.56 and low of 25,369. The Nifty closed with a loss of 87 points at 7,783. The  Nifty opened at 7,785 hitting a high of 7,876 and low of 7,775.
  • A win for the BJP in Assam failed to lift market sentiments, weighed down by concerns of a near-term US interest rate hike.
  • Asian equity markets ended mostly lower on Thursday, with risk sentiment hurt by falling commodity prices and a surging dollar, after the Federal Reserve’s April meeting minutes revealed ‘most’ members have a strong bias for raising rates as early as June, based on how the economy evolves.
  • European market fell on Thursday, with weaker oil and metals prices putting pressure on commodity stocks. Possibility of an interest rate hike by the US Federal Reserve as early as June further dampened market sentiments.
  • The rupee plummeted 23 paise against the US dollar to 67.20 in early trade on Thursday, its weakest level since March, due to appreciation of dollar amid foreign fund outflows.
  • TOP GAINERS: Bharti Infratel, BPCL, Power Grid, Wipro, Zee Ent,Lupin, Tata Motors, TCS, 
  • TOP LOSERS: Hero MotoCorp Adani Ports, SBI, Bank of Baroda, L&T, Eicher Motors and HDFC 

Wednesday, May 18, 2016

TECHNICAL ANALYSIS OF CEATLTD FOR 19 MAY

FUTURE :
“BUY CEATLTD ABOVE 1015 TGT 1025/1050”
 “SELL CEATLTD BELOW 1004 TGT 990/975”
DAILY CHART FOR CEATLTD:
Market to see Sharp Correction, Watch out 7780 or 7910 for further direction
CEATLTD  is a buy with a stop loss of Rs 1,000 for target of Rs 1,050/1075. Today, The Sensex ended with a loss of 69 points at 25,705. The Sensex opened at 25,671 touched an intra-day high of 25,747 and low of 25,503.The Nifty closed with a loss of 21 points at 7,870. The Nifty opened at 7,847 hitting a high of 7,882 and low of 7,811. Indian Stock Market would open negative. Technically, Indian Stock Market is still in positive zone. Now, Nifty would see some sharp correction today. Nifty is moving in a rangebound region. Nifty needs to close above 7910 levels to see a breakout in days to come or else has to close below 7780 levels to see a breakdown. Breaching any of these levels by closing would force market to move sharply in that direction. Traders can buy near support and sell near resistance levels until any of these levels are not breached on closing basis. Nifty would see strong support at 7815-7780-7730-7715 whereas strong resistance would be seen at 7896-7926-7980 levels.
TOP GAINERS: ONGC, SBI, Adani Ports,  L&T, Dr.Reddy's and Lupin
TOP LOSERS: Maruti Suzuki, BHEL, Bajaj-Auto, Hero MotoCorp, Tata Motors and Asian Paints

Tuesday, May 17, 2016

TECHNICAL ANALYSIS OF MOTHERSUMI FOR 18 MAY

APOLLOHOSP IS ON FIREEEEEEEEEEEEEE!!!!!!!!!!!!
IN BULLISH MOMENTUM: HIT TGT 1355 MADE HIGH OF 1363.55 BUY AT 1347
LOT SIZE: 400                                                      
TOTAL PROFIT: 13240 IN JUST TWO LOT
FOR MORE JACKPOT CALLS OF FUTURE PLEASE FILL UP THE FORM GIVEN HERE >>>>>>>>>>>>>>>
FUTURE :
“BUY MOTHERSUMI ABOVE 294 TGT 300/310”
 “SELL MOTHERSUMI BELOW 280 TGT 270/260”
DAILY CHART FOR MOTHERSUMI:
The Sensex ended with a gain of 120 points at 25,775. The Sensex opened at 25,756 touched an intra-day high of 25,927 and low of 25,734. The Nifty closed with a gain of 30 points at 7,891. The Nifty opened at 7,897 hitting a high of 7,940 and low of 7,880. Markets came off their day's high on profit taking at higher levels. Meanwhile, exit polls which indicated BJP emerging victorious in the Assam assembly polls boosted investor sentiment. The Nifty continues to hover close to its own 200-Day Moving Average (200-DMA). It has moved above and slid below without a decisive swing in either direction. This volatile behaviour makes it very hard to definitively call the long-term trend. However, breadth and volume indicators look positive. Ideally, the Nifty should move, say three per cent (200 points or so) above the 200-DMA (the simple 200-DMA is at around 7,820). But, the index has, so far, failed to cross resistance at around 8,000. Equally true, a pullback to 200 points below the 200-DMA could mean this entire rally would be accounted a false breakout. Indian Stock Market would open positive. Technically,

Monday, May 16, 2016

TECHNICAL ANALYSIS OF APOLLOHOSP FOR 17 MAY

FUTURE :
“BUY APOLLOHOSP ABOVE 1347 TGT 1355/1365”
 “SELL APOLLOHOSP BELOW 1330 TGT 1320/1300”
FOR MORE ROCKING CALLS OF FUTURE PLEASE FILL UP THE FORM GIVEN HERE >>>>>>>>>>>>>>>
Initiate Short Positions If 7780 Breaches for Nifty, Till Then Hold Long
DAILY CHART FOR APOLLOHOSP:

The Sensex ended with a gain of 164 points at 25,653. The Sensex opened at 25,529 touched an intra-day high of 25,688 and low of 25,352. The Nifty closed with a gain of 46 points at 7,861. The Nifty opened at 7,831 hitting a high of 7,874 and low of 7,772. Indian Stock Market would open flat with negative bias. Technically, Indian Stock Market is still in positive zone. Till now, Market is holding 7780 levels for Nifty by closing but once it closes below those levels, Nifty would enter into negative zone and we could see sharp downfall upto 7715-7550 levels. Reversal levels of BankNifty would remain at 16500 levels. If Market is able to hold those levels and rebound then we would see some resistance near 7926-7980 levels. So, now traders should wait and see any of these levels to breach or sustain for further trading decisions. The trade is to buy at supports and sell at resistance levels with small stoplosses. Nifty would see strong support at 7780-7730-7715-7675 whereas strong resistance would be seen at 7843-7881-7926-7980 levels.
TOP GAINERS:Yes Bank, Bharti Infratel, Bosch, ITC, Dr.Reddy's, HDFC, Tech Mahindra, HDFC Bank and HUL
TOP LOSERS: Bank of Baroda, SBI, Cipla, Adani Ports, Idea Cellular, BHEL and  ICICI Bank 

Friday, May 13, 2016

WEEKLY AXISBANK CALL FOR 16 MAY 2016

LAST WEEKLY RECOMMENDATION:
VOLTAS IS ON FIREEEEEEEEE …!!!!!!!!!!!!
IN BULLISH MOMENTUM: HIT TGT  320 MADE HIGH OF 328.90
LOT SIZE: 1600
WEEKLY TOTAL PROFIT: 60480 IN JUST TWO LOT
LAST DAILY RECOMMENDATION:
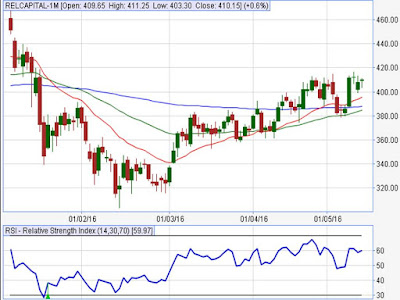
RELCAPITAL HIT FINAL TGT 395  MADE LOW OF 392.10 SELL AT  400
LOT SIZE: 1500
DAILY TOTAL PROFIT: 23700 IN JUST TWO LOT
FOR MORE ROCKING CALLS OF FUTURE PLEASE FILL UP THE FORM GIVEN HERE >>>>>>>>>>>>>>>
DAILY CHART FOR VOLTAS & RELCAPITAL:
 FUTURE :
“BUY AXISBANK ABOVE 495 TGT 505/520”
 “SELL AXISBANK BELOW 482 TGT 478/470”

Axis Bank, are appropriate for buying. Even for short term as well as for a larger positional trade. For the last six months, Axis Bank   is trading in a range of Rs 380 and Rs 480. last week the stock has given a breakout from this range and we are seeing fresh long positions getting built up. Axis Bank   is showing quite a bit of strength. So, from that perspective, I assume that the stock would not fall below Rs 484. So, even if it were to open gap down and if it does not violate Rs 484 or even if it violates and quickly recovers to levels above Rs 484, it is still a buy and I would put a stop below Rs 480 and targets would remain at Rs 494 to about Rs 505. So, that is how you play Axis Bank.

Thursday, May 12, 2016

TECHNICAL ANALYSIS OF RELCAPITAL FOR 13 MAY 2016

FUTURE :
“BUY RELCAPITAL ABOVE 412 TGT 416/422”
 “SELL RELCAPITAL BELOW 400 TGT 395/388”
FOR MORE ROCKING CALLS OF FUTURE PLEASE FILL UP THE FORM GIVEN HERE >>>>>>>>>>>>>>>
DAILY CHART FOR RELCAPITAL:
Snapping Wednesday's losses, the  Sensex on Thursday added 193 points, The Sensex ended with a gain of 193 points at 25,790. The Sensex opened at 25,685 touched an intra-day high of 25,827 and low of 25,620. while the broader  Nifty topped its key 7,900-mark.The Nifty closed with a gain of 52 points at 7,900.40. The Nifty opened at 7,871.45 hitting a high of 7,916 and low of 7,850. , markets bounced back today owing to a spectacular rally in bank stocks after the Rajya Sabha passed the  Bankruptcy Bill. In the banking pack, ICICI Bank, SBI, IndusInd Bank, HDFC Bank and Bank of Baroda surged between 0.2%-4% to the passage of Bankruptcy Bill.

Wednesday, May 11, 2016

LAST RECOMMENDATION UPDATE: GIVEN ON 10 MAY

STAR IS ON FIREEEEEEEEEEEEEE!!!!!!!!!!!!
IN BULLISH MOMENTUM: HIT TGT 1160 MADE HIGH OF 1165.75 BUY AT 1150
LOT SIZE: 400                                                      
TOTAL PROFIT: 8000 IN JUST TWO LOT
FOR MORE JACKPOT CALLS OF FUTURE PLEASE FILL UP THE FORM GIVEN HERE >>>>>>>>>>>>>>>
INTRADAY CHART FOR STAR:
In a volatile session on Wednesday, the S&P BSE Sensex pared initial losses to settle the day 175 points lower, while the broader CNX Nifty ended below its key 7,850-mark.The Sensex ended with a loss of 176 points at 25,597. The Sensex opened at 25,549 touched an intra-day high of 25,762 and low of 25,409.The Nifty closed with a loss of 39 points at 7,848. The Nifty opened at 7,805 hitting a high of 7,893 and low of 7,781. Today, Indian Stock Market open gap negative. Technically, Indian Stock Market is in positive zone but the news on Capital

Tuesday, May 10, 2016

TECHNICAL ANALYSIS OF STAR FOR 11 MAY 2016

FUTURE :
“BUY STAR ABOVE 1150 TGT 1160/1175”
 “SELL STAR BELOW 1135 TGT 1125/1110”
FOR MORE ROCKING CALLS OF FUTURE PLEASE FILL UP THE FORM GIVEN HERE >>>>>>>>>>>>>>>
DAILY CHART FOR STAR:
Strides Shasun's FY16 results on May 16, 2016 Strides Shasun Ltd has informed BSE that a meeting of Board of Directors of the Company is scheduled to be held on May 16, 2016, inter alia, to consider the audited financial results of the Company for the financial year ended March 31, 2016 and recommendation of dividend "In Strides Shasun   again a bottom is being made and it has been holding averages. So this is a buy with a stop loss of Rs 1,120, target of Rs 1,165/1175," .The Sensex ended with a gain of 84 points at 25,773. The Sensex opened at 25,683 touched an intra-day high of 25,810 and low of 25,614. The Sensex fell by some 35 points in early trade on Tuesday as funds and retail investors booked profits after yesterday's strong gains amid mixed Asian cues.