Wednesday, August 17, 2016

MARKET CONSOLIDATING, BUY AT DIPS, BREAKOUT EXPECTED IF BANKNIFTY CLOSES ABOVE 19070

LAST DAILY RECOMMENDATION:
IN BeariSH MOMENTUM: ADANIPORTS HIT FIrst TGT 270 MADE A low  OF 266
LOT SIZE: 2500
DAILY TOTAL PROFIT: 22500 IN JUST ONE LOT
FOR MORE ROCKING CALLS OF FUTURE PLEASE FILL UP THE FORM GIVEN HERE >>>>>>>>>>>>>>>
We continue to see considerable call buildup around the 8700 levels, this suggests that smart money may not be betting on a big rally to take the markets much higher above 8700 in the near future. PCR ratio is around the 0.91 levels which could also mean overall retail outlook is still positive and most retail participant expect the markets to move up from this juncture." Indian Stock Market was open negative. Technically, Indian Stock Market entered into positive trend. Market is still in consolidation phase and would see sharp breakout once BankNifty closes above 19070 levels. If Bank Nifty manages to close above 19070, then the next target would be 19300-19500-20000 levels in days to come. Some sharp correction would be seen but traders should buy at dips and sell at positive rally near resistance levels. Once BankNifty breaches levels of 19070 by closing then traders can go long with full quantity and enjoy huge profits
TOP GAINERS: Tata Steel, Coal India, Aurobindo Pharma, Bajaj Auto, Hero MotoCorp
TOP LOSERS:  Adani Ports, TCS, Tech Mahindra, Power Grid, Infosys and Idea Cellular
Tuesday, August 16, 2016

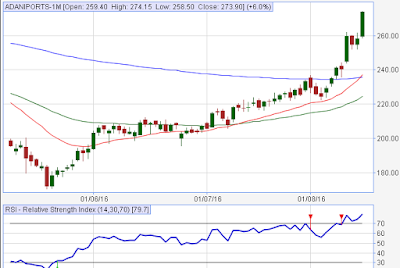
TECHNICAL ANALYSIS OF ADANIPORTS FOR 17 AUG 2016

“BUY ADANIPORTS ABOVE 280 TGT 285/290”
“SELL ADANIPORTS BELOW 275 TGT 270/265.”
Primary trend of the stock is bullish and It is expected to continue the bull run with the crossing of the resistance level of 280, as the stock is sustaining above its 200 and 50 days moving averages. One may initiate the long position above the mentioned level for the targets of 290/300 and with the strict stop loss of 270.Today, Sensex ended with a loss of 88 points at 28,065. The Sensex opened at 28,190 touched an intra-day high of 28,199 and low of 27,943. The Nifty closed with a loss of 30 points at 8,643. The Nifty opened at 8,670 hitting a high of 8,682 and low of 8,600. The Sensex and Nifty closed lower on Tuesday after WPI inflation hit 23-month high. Inflation for the month of July soared to 3.55% versus

Friday, August 12, 2016

WEEKLY ANALYSIS OF YESBANK FOR 16-19 AUG


LAST WEELY RECOMMENDATION:
IN BULLISH MOMENTUM: ZEEL HIT TGT 520 MADE HIGH OF 518.35
LOT SIZE: 1300
DAILY TOTAL PROFIT: 47710 IN JUST TWO LOT
FOR MORE ROCKING CALLS OF FUTURE PLEASE FILL UP THE FORM GIVEN HERE >>>>>>>>>>>>>>>
FUTURE:
“BUY YESBANK ABOVE 1300 TGT 1315/1330”
“SELL YESBANK BELOW 1280 TGT 1260/1240”
DAILY CHART FOR YESBANK:
Primary trend of the stock is bullish and after giving breakout of its range bound movement, it is forming continuation pattern in short term charts, it is likely to continue the positive movement with the breakout of the pattern at the levels of 1300 ; as the stock is managing to trade above its 50 and 200 days moving averages with the RSI of 80, one may expect the targets of 1330  in the stock if it manages to sustain above the immediate support level of 1280. The stock is in bull run and is forming a reversal pattern also in short term charts, it is likely to show correction with the breach of the support level of 1280, where one may initiate the short position in it for the targets of 1250, while stop loss can be placed at 1300.Today, Sensex ended with a gain of 293 points at 28,152. The Sensex opened at 27,919, touched an intra-day high of 28,203 and low of 27,901.The Nifty closed with a gain of 80 points at 8,672. The Nifty opened at 8,605 hitting a high of 8,684 and low of 8,604.

Thursday, August 11, 2016

TECHNICAL ANALYSIS OF LUPIN FOR 12 AUG 2016

“BUY LUPIN ABOVE 1582 TGT 1612/1635”

“SELL LUPIN BELOW 1560 TGT 1540/1520”
Lupin After showing correction from the higher level, now stock is trading in short term recovery phase, it is likely to continue the upside move in near term with the crossing of the resistance level of 1600 as the stock is managing to sustain above the level of 1600. One may get the targets of 1620,1650 in the stock with the stop loss of 1560.Today, After falling for past two trading sessions, the Indian stock market see-sawed between negative and positive zone throughout the day and ended higher snapping its losing streak. Sensex ended with a gain of 85 points at 27,860. The Sensex opened at 27,806 touched an intra-day high of 27,902 and low of 27,697.The Nifty closed with a gain of 17 points at 8,592. The Nifty opened at 8,573 hitting a high of 8,601 and low of 8,540. "Markets  taking a breather

Wednesday, August 10, 2016

NIFTY FALL FOR 2ND STRAIGHT DAY, NIFTY SHUTS BELOW 8,600 MARK

The Sensex lost 310.28 points or 1.1% to settle at 27,774.88, its lowest closing level since 4 August 2016. The index lost 348.54 points or 1.24% at the day's low of 27,736.62. The index rose 58.12 points or 0.21% at the day's high of 28,143.28.The Nifty dropped 102.95 points or 1.19% to settle at 8,575.30, its lowest closing level since 4 August 2016. The index shed 113.65 points or 1.31% at the day's low of 8,564.60. The index rose 11.85 points or 0.14% at the day's high of 8,690.10. Indian Stock Market would open flat. Technically, Indian Stock Market is still in positive zone. Now Market is in a range bound region. Nifty if closes below 8626, then it would see a sharp breakdown in upcoming days. Traders can hold long positions or go long at dips until Nifty holds 8626 levels by closing. There are strong chances of renounce if Nifty holds those levels by closing else a sharp breakdown is confirmed. Traders should watch 8626 levels by closing and if it closes below those levels, traders can

Tuesday, August 9, 2016

LAST RECOMMENDATION UPDATE: GIVEN ON 08 AUG

LAST DAILY RECOMMENDATION:
IN BEARISH MOMENTUM: HDFC HIT TGT 1345  MADE A HIGH OF 1338.55
LOT SIZE: 500
DAILY TOTAL PROFIT: 31450 IN JUST ONE LOT
FOR MORE ROCKING CALLS OF FUTURE PLEASE FILL UP THE FORM GIVEN HERE >>>>>>>>>>>>>>>
Reserve Bank Governor Raghuram Rajan kept key rates unchanged
The Sensex and Nifty closed lower on Tuesday, pausing after a three-day rally, as investors booked profits after the central bank kept its policy interest rate unchanged and retained FY17 GDP growth forecast at 7.6%. Sensex ended with a loss of 97 points at 28,085. The Sensex opened at 28,289 touched an intra-day high of 28,290 and low of 27,957. Nifty closed with a loss of 33 points at 8,678. The Nifty opened at 8,727 hitting a high of 8,728 and low of 8,638. Raghuram Rajan, whose 3-year term will come to an end on September 4, left interest rates unchanged at his final policy review meeting as RBI governor. Rajan left the repurchase, or repo, rate unchanged at 6.5% as retail inflation for the month of June headed to 5.77%, driven in large

Monday, August 8, 2016

NULL EFFECT EXPECTED ON THE MARKET; ON ACCOUNT OF RBI POLICY

“BUY HDFC ABOVE 1370 TGT 1385/1400”
“SELL HDFC BELOW 1360 TGT 1345/1330”
The Indian equity market rallied for third consecutive session on Monday ahead of RBI policy review on Tuesday. Reserve Bank Governor Raghuram Rajan, whose 3-year term will come to an end on September 4, is widely expected to hold the key interest rate on Tuesday as retail inflation continues to be above the comfort zone. Sensex ended with a gain of 104 points at 28,183. The Sensex opened at 28,182 touched an intra-day high of 28,226 and low of 28,128.The Nifty closed with a gain of 28 points at 8,711. The Nifty opened at 8,713 hitting a high of 8,723 and low of 8,697. Market is expected to see short term correction if it breaks

Friday, August 5, 2016

WEEKLY TECHNICAL ANALYSIS OF ZEEL FOR 08-12 AUG

LAST WEELY RECOMMENDATION:
IN BULLISH MOMENTUM: ZEEL HIT TGT 510 MADE HIGH OF 511.80
LOT SIZE: 1300
WEEKLY TOTAL PROFIT: 22880 IN JUST TWO LOT
FOR MORE ROCKING CALLS OF FUTURE PLEASE FILL UP THE FORM GIVEN HERE >>>>>>>>>>>>>>>
“BUY ZEEL ABOVE 500 TGT 510/520”
“SELL ZEEL BELOW 490 TGT 485/477”
WEEKLY CHART FOR MARUTI:

Primary trend of the stock is bullish and after giving breakout of its range bound movement, it is forming continuation pattern in short term charts, it is likely to continue the positive movement with the breakout of the pattern at the levels of 470 ; as the stock is managing to trade above its 50 and 200 days moving averages with the RSI of 70, one may expect the targets of 520  in the stock if it manages to sustain above the immediate support level of 490. The stock is in bull run and is forming a reversal pattern also in short term charts, it is likely to show correction with the breach of the support level of 480, where one may initiate the short position in it for the targets of 455, while stop loss can be placed at 510.