Wednesday, April 5, 2017

STOCK FUTURE TRADING TIP FOR 06 APRIL

buy JUSTDIAL above 555 tgt 565/575 sl 540
Primary trend of the JUSTDIAL is bullish and After showing correction from the higher level, now stock is trading in short term recovery phase, it is likely to continue the upside move in near term with the crossing of the resistance level of 45 as the stock is managing to sustain above the level of 500. One may get the targets of 565,575 in the stock with the stop loss of 540.After giving breakout of its MONTHLY PIVORT POINT range bound movement, it is forming continuation pattern in short term charts, it is likely to continue the positive movement with the breakout of the pattern at the levels of 556 ; as the stock is managing to trade above its 22 and 55&200 days moving averages with the RSI of 55, first resistance level seen on charts at 569.

Tuesday, April 4, 2017

BANKNIFTY REPORT FOR FINANCIAL YEAR 2018

BANKNIFTY STILL IN POSITIVE MOMENTUM, HOLD LONG WITH STRICT SL 21295
Technically, Indian Stock Market is still in positive zone but market has witnessed divergence on the last trading session of the Financial Year 2017. Now, we are into new Financial Year 2018 and on 3 April positive movement was already decide the market direction. Some profit booking can’t be ruled out at this point of time. Market would wait for RBI Monetary Policy meeting on April 05-06 and then would see some correction before resuming the positive rally.
TO READ FULL REPORT VISIT
NIFTY TRADING TIPS

Monday, April 3, 2017

BEST STOCK FUTURE TO TRADE ON 05 APRIL 2017

buy UPL above 748 tgt 755/758 sl 740


Primary trend of the UPL is bullish and after giving breakout of its MONTHLY PIVORT POINT range bound movement, it is forming continuation pattern in short term charts and near to breakout first monthly resistance level at 750, it is likely to continue the positive movement with the breakout of the pattern at the levels of 750 ; as the stock is managing to trade above its 22 and 55&200 days moving averages with the RSI of 60, one may expect the targets of 755/765 in the stock if it manages to sustain above the immediate support level of 740/720.

Friday, March 31, 2017

WEEKLY BUY HEROMOTOCO FUTURE FOR 03-07 APRIL

buy HEROMOTOCO above 3250 tgt 3280/3330 sl 3210
Primary trend of the HEROMOTOCO is bullish and it is near to give breakout of its MONTHLY PIVORT POINT range bound movement of 3260, it is forming continuation pattern in short term charts, it is likely to continue the positive movement with the breakout of the pattern at the levels of 3260; as the stock is managing to trade above its 55&200 days moving averages with the RSI of 45, one may expect the targets of 3280/3330 in the stock if it manages to sustain above the immediate support level of 3200.22 EMA at 3280 seen as a first resistance level .
Market In Positive Momentum, Hold Long Positions Or Buy At Dips
The surged to an intraday high of 9,208 after opening at 9,185. However, it failed to sustain higher and has come-off from the day’s high.Immediate support is at 9,175. A break below it

Wednesday, March 29, 2017

YESTERDAY’S RECOMMENDATION UPDATE:

MOTHERSUMI ALMOST HIT FINAL TGT 382 MADE HIGH OF 381.35

 BUY GIVEN AT 372
LOT SIZE: 2500

NOW TOTAL PROFIT: 32750 IN JUST 2 LOT

BUY tcs ABOVE 2450 TGT 2480/2490 SL 2410

Primary trend of  TCS is bearish and, BUT it is forming reversal pattern in short term charts, it is likely to continue the positive movement with the breakout of the pattern at the levels of 2460 at 22 EMA of resistance level . and 55&200 days moving averages seen as support level with the RSI of 50, one may expect the targets of 2480/2490 in the stock if it manages to sustain above the immediate support level of 2450.

Tuesday, March 28, 2017

YESTERDAY’S RECOMMENDATION UPDATE:

JETAIRWAYS almost HIT  final TGT 518 MADE HIGH OF 517.35

 BUY GIVEN AT 503
LOT SIZE: 1000
NOW TOTAL PROFIT: 28700 IN JUST 2 LOT

Buy MOTHERSUMI above 372 tgt 378/382 sl 365
Primary trend of the MOTHERSUMI is bullish and after giving breakout of its MONTHLY PIVORT POINT range bound movement, it is forming continuation pattern in short term charts, it is likely to continue the positive movement with the breakout of the pattern at the levels of 370 ; as the stock is managing to trade above its 22 and 55&200 days moving averages with the RSI of 67, one may expect the targets of 378/385 in the stock if it manages to sustain above the immediate support level of 370.first resistance level seen on charts at 382.
Go Long Until Nifty Closes Below 9020
Sensex ended at 29,409, up 172 points, while Nifty closed at 9,100, up 55 points.  Technically, Nifty is still in negative zone. Closing below 9020 would force Nifty to see sharp downfall but until Nifty holds 9020, there is strong chances of sharp bounce in the market. Once Nifty closes above 9123 levels, market would move towards new highs but until then sideways movement would be seen. Traders can go long at dips until Nifty holds 9020 on closing basis.

Monday, March 27, 2017

BEST STOCK FUTURE TO TRADE ON 28 MAR 2017

buy JETAIRWAYS above 503 tgt 512/518 sl 495


Primary trend of the JETAIRWAYS is bullish and after giving breakout of its MONTHLY PIVORT POINT range bound movement, it is forming continuation pattern in short term charts, it is likely to continue the positive movement with the breakout of the pattern at the levels of 500 ; as the stock is managing to trade above its 22 and 55&200 days moving averages with the RSI of 73, one may expect the targets of 512/528 in the stock if it manages to sustain above the immediate support level of 500.first resistance level seen on charts at 530.

Friday, March 24, 2017

WEEKLY STOCK TIP "SELL LT FUTURE"

AXISBANK GIVEN ON 22 MARCH POST HIT  FINAL TGT 495 MADE HIGH OF 497.15
LOT SIZE: 1200
NOW TOTAL PROFIT: 27960 IN JUST 2 LOT

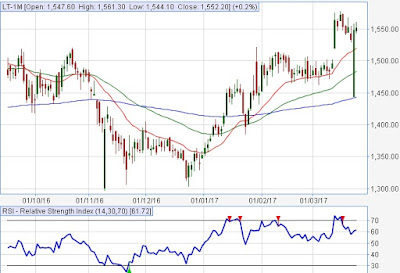
sell lt below 1555 tgt 1520/1490 sl 1585

The stock is in bull run and is forming a reversal pattern in short term charts, it is likely to show correction with the breach of the support level of 1555, where one may initiate the short position in it for the targets of 1520/1490 while stop loss can be placed at 1585.All the 22,55 &200 EMA seen on chart as support levels at 1520/1490/1440 with RSI of 60.