TO GET LIVE CALLS PLEASE FILL UP THE FORM GIVEN HERE>>>
Thursday, March 8, 2018
STOCK FUTURE CALL FOR 09 MAR 2018
Wednesday, March 7, 2018
MARUTI IS IN SHORT TERM REVERSAL PHASE
SELL MARUTI BELOW 8720 TGT 8650/8575 SL 8800
TO GET LIVE CALLS PLEASE FILL UP THE FORM GIVEN HERE>>>
TECHNICAL VIEW: Maruti is forming a reversal pattern in short-term charts, the Primary trend of the MARUTI is bearish. Strong Support level is seen on the daily chart at 8550. , it is likely to show correction with the breach of the support level of 8575, where one may initiate the short position in it for the targets of 8500, while stop loss can be placed at 8800. as the stock is managing to trade BELOW its 22& 55 days moving averages with the RSI of 40. After the breakout, the level of 8800 One may get the targets of 8850,8950 in the stock with the stop loss of 8500.200 EMA seen as a strong support at 8199 .
Monday, March 5, 2018
Thursday, March 1, 2018
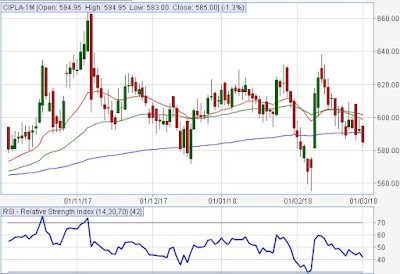
CIPLA BEARISH; AS PREDICTED ON 28 FEB 2018
CIPLA ROCKSS ACHIEVED TARGET 588
TOTAL
PROFIT : 18000 IN JUST 2 LOT
TO GET NEXT WEEKLY CALL
WHATS UP ME ON 09039542248
FOR
FREE NIFTY/FUTURE/TIPS FILL UP THE FORM HERE>>>>>
Wednesday, February 28, 2018
STOCK FUTURE TRADING TIP FOR 01 MARCH 2018
SELL CIPLA BELOW 592 TG 588/580 SL 600
FOR FREE NIFTY/FUTURE/TIPS FILL UP THE FORM HERE>>>>>
TO READ NIFTY REPORT VISIT http://niftytipsniftylevels.blogspot.com/
The CIPLA is in downtrend and is forming a continuation pattern in short term charts, it is likely to show correction with the breach of the support level of 592, where one may initiate the short position in it for the targets of 588,580 while stop loss can be placed at 600 .22&55 EMA seen as resistance levels on intraday charts .
Tuesday, February 27, 2018
STOCK OF THE DAY !!
BUY GODREJCP ABOVE 1092 TGT 1105/1125 SL 1075
FOR FREE NIFTY/FUTURE/TIPS FILL UP THE FORM HERE>>>>>
TO READ NIFTY REPORT VISIT http://niftytipsniftylevels.blogspot.com/
TECHNICAL VIEW: The Rounding Bottom pattern
seen in daily chart of GODREJCP. It is a long-term reversal pattern that is
best suited for weekly charts. It is also referred to as a saucer bottom, and represents a long consolidation period that
turns from a bearish bias to a bullish bias.
After showing correction from
the higher level, now GODREJCP is trading in recovery phase, it is likely to
continue the upside move in near term with the crossing of the resistance level
of 1100 as the stock is managing to sustain above the level of 1100. It
is likely to continue the positive movement towards 1125/1150. 22 and
55&200 days moving averages seen as SUPPORT level with the RSI of
70, One may get the targets of 1125,1150 in the stock with the stop loss
of 1075. Primary trend of the GODREJCP is bullish. Strong Support level
seen on daily chart at 1050. 1114/1124 level seen as a strong resistance
level.
DAILY CHART
FOR GODREJCP:
Monday, February 26, 2018
M&M BULLISH; AS PREDICTED ON 21 FEB 2018
M&M ROCKSS ACHIEVED
TARGET 730
TOTAL PROFIT : 25400
ON 09039542248
TO READ NIFTY REPORT VISIT http://niftytipsniftylevels.blogspot.com/
DAILY CHART FOR M&M
Friday, February 23, 2018
WEEKLY STOCK FUTURE CALL FOR 26 FEB -02 MAR
BUY SYNDIBANK ABOVE 61.40 TGT 62.20/64
TO GET LIVE CALLS PLEASE FILL UP THE FORM GIVEN HERE>>>
Primary trend of the SYNDIBANK is bullish for now and After showing correction from the higher level of 95.90, now stock is trading in short-term recovery phase, it is forming reversal pattern in short-term charts, it is likely to continue the positive movement with the breakout of the pattern at the levels of 61.4 as the stock is managing to trade above its 22 days moving averages with the RSI of 40, one may expect the targets of 65/70 in the stock if it manages to sustain above the immediate strong support level of 60. strong resistance would be seen at 65 AT 22 EMA level. and Below 60 you may expect the target of 58/55.
Subscribe to:
Posts (Atom)


