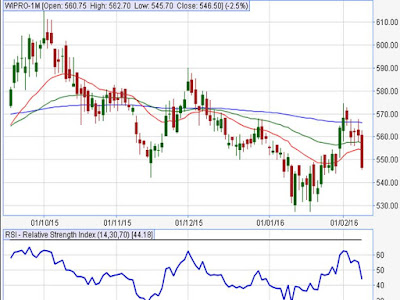
FUTURE:
"BUY
WIPRO ABOVE 550 TGT 555/565 "
"SELL WIPRO
BELOW 545 TGT 540/530 "
DAILY
CHART FOR WIPRO:
MARKET SUMMARY OF 08 FEB
2016:
The Sensex opened at 24,637, touched an intra-day high of 24,699 and
low of 24,261. It finally ended with a loss of 330 points at 24,287.The
Nifty opened at 7,490 hitting a high of 7,513 and low of 7,363, before ending
with a loss of 102 points at 7,387. The Indian equity market closed deep
in the red as a massive sell-off in the closing hour of trade dragged the NSE
Nifty to end below the 7400 mark on Monday.
Sentiment was hit after negative
cues from the European markets and a sharp fall in the Dow Jones Futures index
in the US spooked sentiment. In addition, Indian rupee yet again began
weakening towards the Rs68 per dollar mark. Market participants preferred to
get rid of their positions ahead of the Q4 GDP and GVA YoY data, which is
scheduled to be released later today.
No comments:
Post a Comment