Tuesday, February 16, 2016

MARKET SUMMARY OF 16 FEB 2016

The Sensex opened at 23,689, touched an intra-day high of 23,692 and low of 23,165. It finally ended with a loss of 362 points at 23,191.The  Nifty opened at 7,201 hitting a high of 7,205 and low of 7,038, before ending with a loss of 115 points at 7,048. The sharp selloff pushed the Nifty50 below its crucial support level of 7,100, which closed marginally above 7,000. The index has an important support at 6,936-7,050 level and if it slips below that, further correction cannot be ruled out. All the sectoral indices ended with losses. The Capital Goods index was the top loser, followed by BSE realty, telecom, oil & gas and healthcare index. Consumer durables, banking, auto and FMCG index was among the other major losers. Even the Small-Cap and Mid-Cap stocks were not spared.
TOP GAINERS:
Adani Ports, NTPC, Hero MotoCorp, Power Grid, IndusInd Bank, Dr.Reddy's Lab and Cairn India
TOP LOSERS:
SBI, ZEEL, Bank of Baroda, PNB, Vedanta, Tata Motors and BHEL 

Monday, February 15, 2016

MARKET SUMMARY OF 15 FEB 2016

The  Sensex opened at 23,223, touched an intra-day high of 23,623 and low of 23,198. It finally ended with a gain of 568 points at 23,554.The  Nifty opened at 7,057 hitting a high of 7,183 and low of 7,057, before ending with a gain of 182 points at 7,163.95. There is a clear short term bottom in place in the index. It has risen from an important Gain angle, and the bottom has happened with a long-tailed hammer line in candlestick parlance. However, there are no clear indications as yet to suggest that it is going to be final bottom for this bear market. In any case, we are in for, at least, bit of a bounce this week. The most critical zone for the day would be between 7023 and 7057; its real test would come when it tries to clear the zone between 7135 – 7210—once this zone is decisively taken out, the market would see the next round of short covering rally.
TOP GAINERS:
Bank of Baroda, Vedanta, Tata Steel, Hindalco, L&T, SBI, Adani Ports and Coal India
TOP LOSERS:
Bharti Airtel, HUL, Idea Cellular and HDFC

Friday, February 12, 2016

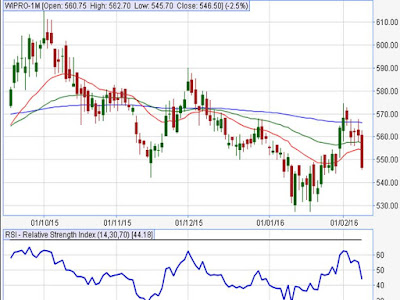
TECHNICAL ANALYSIS OF WIPRO 15 FEB 2016

LAST WEEKLY RECOMMENDATION:
MARUTI IS ON FIREEEEEEEEE …!!!!!!!!!!!!
HIT FINAL TGT 3500  MADE LOW OF 3470.55 SELL AT 3750
LOT SIZE: 125
WEEKLY TOTAL PROFIT: 62500 IN JUST TWO LOT
FUTURE :
“BUY WIPRO BELOW 520 TGT 540/580”
“SELL WIPRO BELOW 510 TGT 480/450”
WEEKLY CHART FOR WIPRO:

Thursday, February 11, 2016

Wednesday, February 10, 2016

YESTERDAY'S UPDATE OF YESBANK

LAST RECOMMENDATION GIVEN ON 04 FEB 2016:
YESBANK IS ON FIREEEEEEEEEEEEEE!!!!!!!!!!!!
IN BEARISH MOMENTUM:  HIT FIRST TGT 740 MADE LOW OF 735 SELL  AT 748
LOT SIZE: 700
TOTAL INTRA DAY PROFIT: 11200 IN JUST TWO LOT
FOR TWO DAYS FREE TRIAL CALLS OF FUTURE PLEASE FILL UP THE FORM GIVEN HERE >>>>>>>>>>>>>>>
INTRADAY CHART FOR YESBANK:

Tuesday, February 9, 2016

TECHNICAL ANALYSIS OF YESBANK 10 FEB 2016

LAST RECOMMENDATION GIVEN ON 08 FEB 2016:
WIPRO IS ON FIREEEEEEEEEEEEEE !!!!!!!!!!!!
IN BEARISH MOMENTUM : WIPRO HIT FIRST TGT 540 MADE LOW OF 535
LOT SIZE: 1000
FUTURE TIP FOR 10 FEB 2016
FUTURE:
"BUY YESBANK  ABOVE 760 TGT 767/760 "
"SELL YESBANK BELOW 752 TGT 745/740 "
DAILY CHART FOR YESBANK:


MARKET SUMMARY OF 28 JAN 2016
The Sensex and Nifty slipped over 1% for the second consecutive session on account of weak cues from the global markets.  IT stocks led the decline after a disappointing quarterly forecast from Cognizant. Cognizant forecast its slowest quarterly revenue growth in 14 years.  Sensex ended with a loss of 266 points at 24,021. It had opened at 24,077, touched an intra-day high of 24,111 and low of 23,919. Nifty ended with a loss of 89 points at 7,298. It had opened at 7,304 hitting a high of 7,323 and low of 7,275.

Monday, February 8, 2016

TECHNICAL ANALYSIS OF WIPRO 05 JAN 2016

FUTURE:
"BUY WIPRO  ABOVE 550 TGT 555/565 "
"SELL WIPRO BELOW 545 TGT 540/530 "
DAILY CHART FOR WIPRO:
MARKET SUMMARY OF 08 FEB 2016:
The Sensex opened at 24,637, touched an intra-day high of 24,699 and low of 24,261. It finally ended with a loss of 330 points at 24,287.The Nifty opened at 7,490 hitting a high of 7,513 and low of 7,363, before ending with a loss of 102 points at 7,387. The Indian equity market closed deep in the red as a massive sell-off in the closing hour of trade dragged the NSE Nifty to end below the 7400 mark on Monday.

Saturday, February 6, 2016

SKSMICRO IS ON FIREEEEEEEEE …!!!!!!!!!!!!
ALMOST HIT FINAL TGT 570  MADE HIGH OF 568.30 BUY AT 527
LOT SIZE: 1000
WEEKLY TOTAL PROFIT: 82600 IN JUST TWO LOT
FUTURE :
 “SELL MARUTI BELOW 3750 TGT 3650/3500”

WEEKLY CHART FOR MARUTI:


Charts usually tell us what is going to happen. Maruti is probably going to see lower levels." Maruti Suzuki   has started its 2016 sales performance on a disappointing note. The country's largest car manufacturer sold 1.13 lakh vehicles in January, down 2.6 percent compared to 1.16 units sold in same period last year. The stock declined 3 percent intraday. "Domestic sales would have been higher, but lesser number of working days in January 2016 impacted overall production and dispatch," the company reasoned.  Maruti exported 7,223 vehicles during the month, lower by a whopping 34.6 percent compared to 11,047 vehicles sold in year-ago period while domestic sales increased 0.8 percent to 1.06 lakh vehicles in same period.
Primary trend of the stock is bearish and is consolidating at the higher level after showing correction. It is expected to continue the bear run with the crossing of the support level of 3710, as the stock is sustaining below  its 55 and 22 days moving averages. One may initiate the short position below the mentioned level for the targets of 3500/3400 .