LAST WEEKLY
RECOMMENDATION:
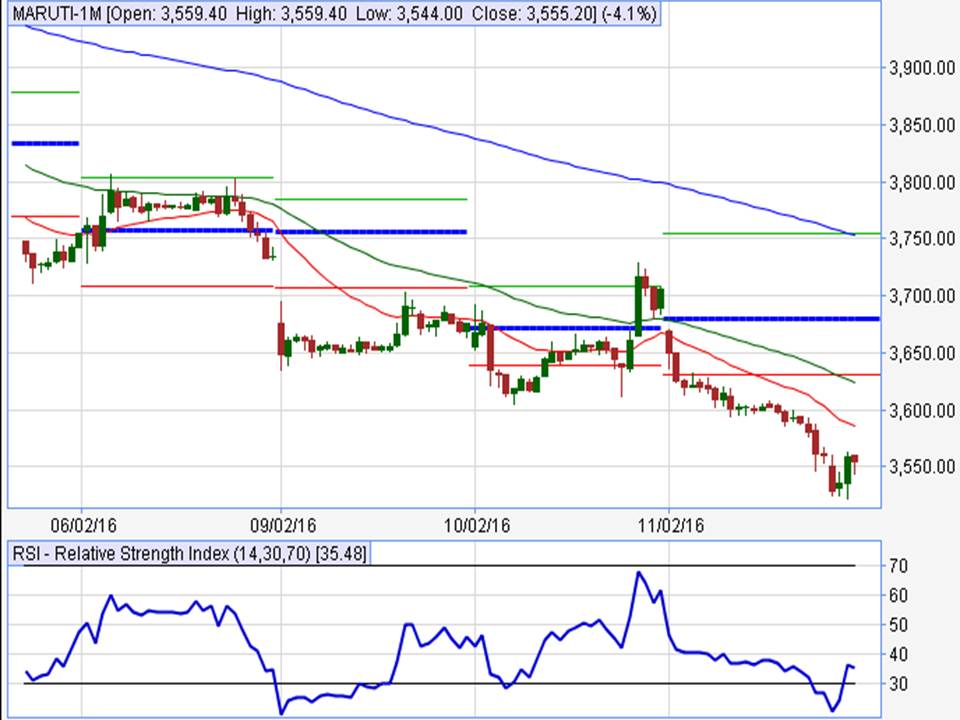
MARUTI
IS ON FIREEEEEEEEE …!!!!!!!!!!!!
HIT FINAL TGT
3500 MADE LOW OF 3470.55 SELL AT 3750
LOT SIZE: 125
WEEKLY TOTAL PROFIT:
62500 IN JUST TWO LOT
FUTURE
:
“BUY WIPRO BELOW 520 TGT 540/580”
“SELL WIPRO BELOW 510 TGT 480/450”
WEEKLY
CHART FOR WIPRO:


